
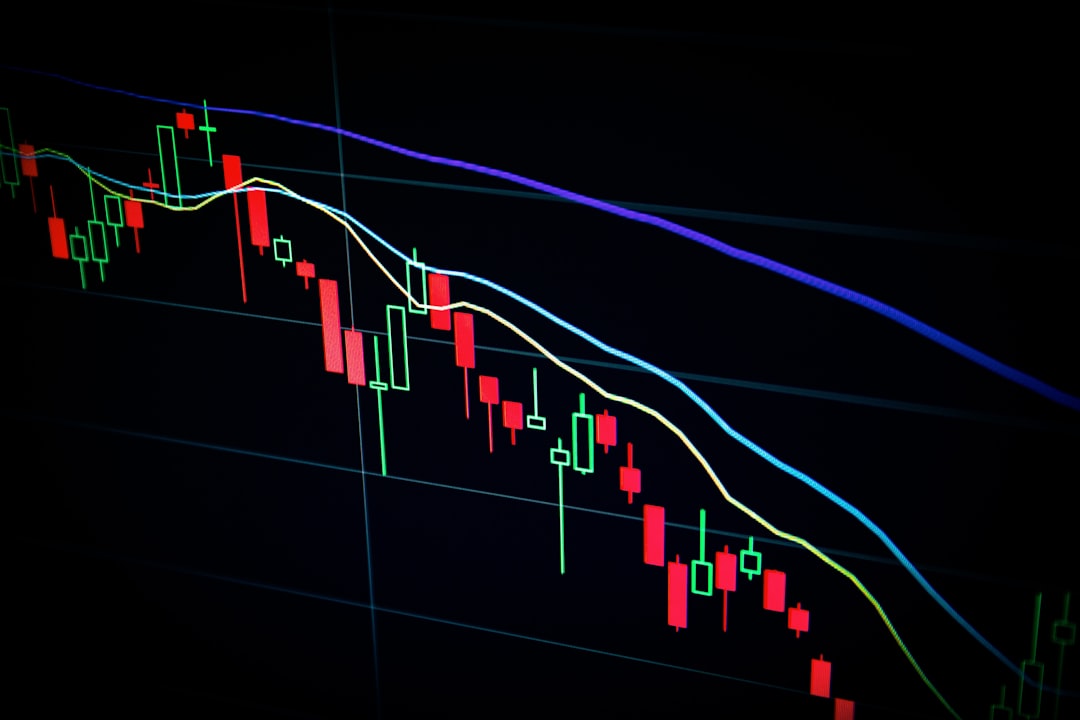
Forex trading requires proper analysis and decision-making skills. Traders often rely on technical indicators to understand market trends, identify opportunities, and manage risks effectively. Among the various tools available, Best Trading Indicators Forex are considered essential because they help traders make informed decisions rather than depending on emotions or guesses.
Why Are Trading Indicators Important?
Trading indicators are mathematical calculations based on price, volume, and market data. They help traders analyze market behavior and predict possible price movements. By using indicators, traders can identify trends, determine entry and exit points, and improve their overall trading strategies.
Indicators are not designed to guarantee profits, but they can significantly improve market understanding when used correctly. Combining different indicators often provides a clearer picture of market conditions.
What Is the Moving Average Indicator?
The Moving Average is one of the most popular indicators in forex trading. It calculates the average price over a specific period and smooths out short-term price fluctuations.
There are two common types of moving averages:
Simple Moving Average (SMA)
Exponential Moving Average (EMA)
This indicator helps traders identify the direction of the trend. When prices stay above the moving average, it may indicate an upward trend, while prices below it may suggest a downward trend.
How Does the Relative Strength Index Help Traders?
The Relative Strength Index, commonly known as RSI, measures the speed and change of price movements. It ranges from 0 to 100 and helps traders determine whether a currency pair is overbought or oversold.
Generally, an RSI value above 70 suggests that the market may be overbought, while a value below 30 may indicate oversold conditions. Many traders use this indicator to identify potential reversal opportunities.
Why Is MACD Popular Among Forex Traders?
The Moving Average Convergence Divergence (MACD) is another widely used indicator. It measures the relationship between two moving averages and helps traders understand momentum.
MACD consists of:
MACD line
Signal line
Histogram
When the MACD line crosses above the signal line, it may indicate a buying opportunity. When it crosses below, it may suggest a selling opportunity. This indicator is useful for spotting trend changes and confirming market direction.
What Does the Bollinger Bands Indicator Show?
Bollinger Bands consist of three lines that move around price action. The bands expand during periods of high volatility and contract when the market becomes calm.
This indicator helps traders identify:
Market volatility
Potential breakout opportunities
Overbought and oversold conditions
When prices touch the upper band, the market may be overbought, while touching the lower band may indicate oversold conditions.
Can the Stochastic Oscillator Improve Trading Decisions?
The Stochastic Oscillator compares the current closing price to a specific price range over a certain period. It is mainly used to identify momentum and possible reversals.
The indicator moves between 0 and 100. Readings above 80 may indicate overbought conditions, while readings below 20 may suggest oversold conditions.
Many traders use this indicator together with trend indicators for more reliable signals.
How Should Traders Use Indicators Effectively?
No single indicator works perfectly in every market condition. Successful traders often combine several indicators to confirm signals before making decisions. Risk management and discipline remain important factors regardless of the indicators being used.
Testing indicators on historical data and practicing in different market conditions can help traders understand their strengths and limitations.
Conclusion?
Trading indicators are valuable tools that help traders analyze market behavior and make better decisions. Moving Averages, RSI, MACD, Bollinger Bands, and the Stochastic Oscillator are among the most useful indicators in forex trading. Learning how these indicators function and applying them properly can improve trading confidence and provide a more structured approach to the forex market.